

JUNO beat every previous measurement in 59 days. Its real target is still years away.
The commissioning paper reports 1785 photoelectrons per MeV, 20.6 m scintillator transparency and uranium below 10⁻¹⁶ g/g. The first physics paper reports the world's best solar oscillation parameters from 59.1 days of data. The flagship result is not among them.
In this article
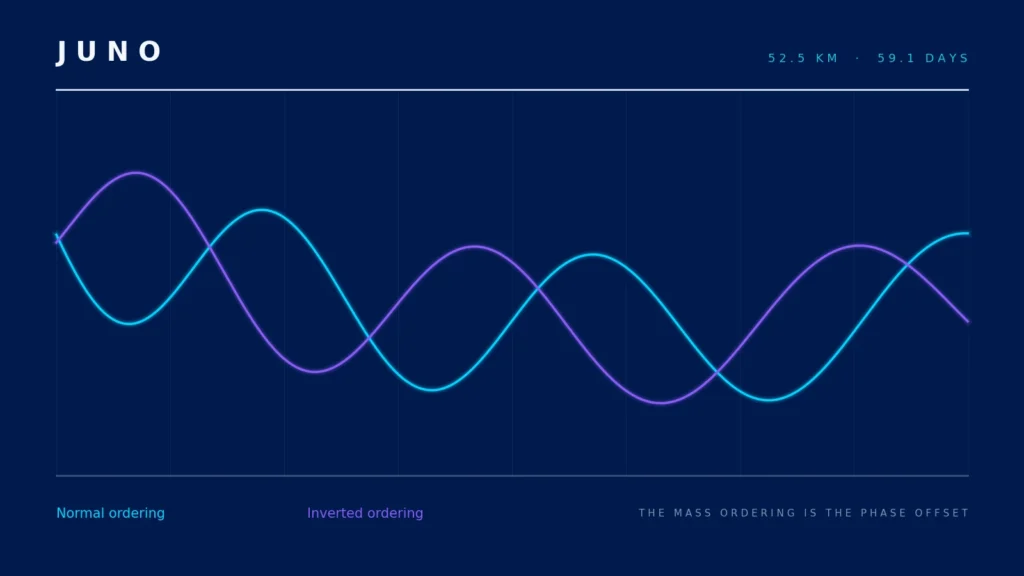
JUNO began taking physics data on 26 August 2025. Fifty-nine days of that data were enough to produce the world’s most precise values for two of the parameters that govern neutrino oscillation, beating the combination of every previous measurement by a factor of 1.6. Those are not the numbers the detector was built for. The 20 kton of liquid scintillator buried under a granite hill in Guangdong exists to settle the neutrino mass ordering, and on that question the collaboration is still years from an answer. The commissioning paper explains why both statements are true at once.1, 2
The measurement is an interference pattern
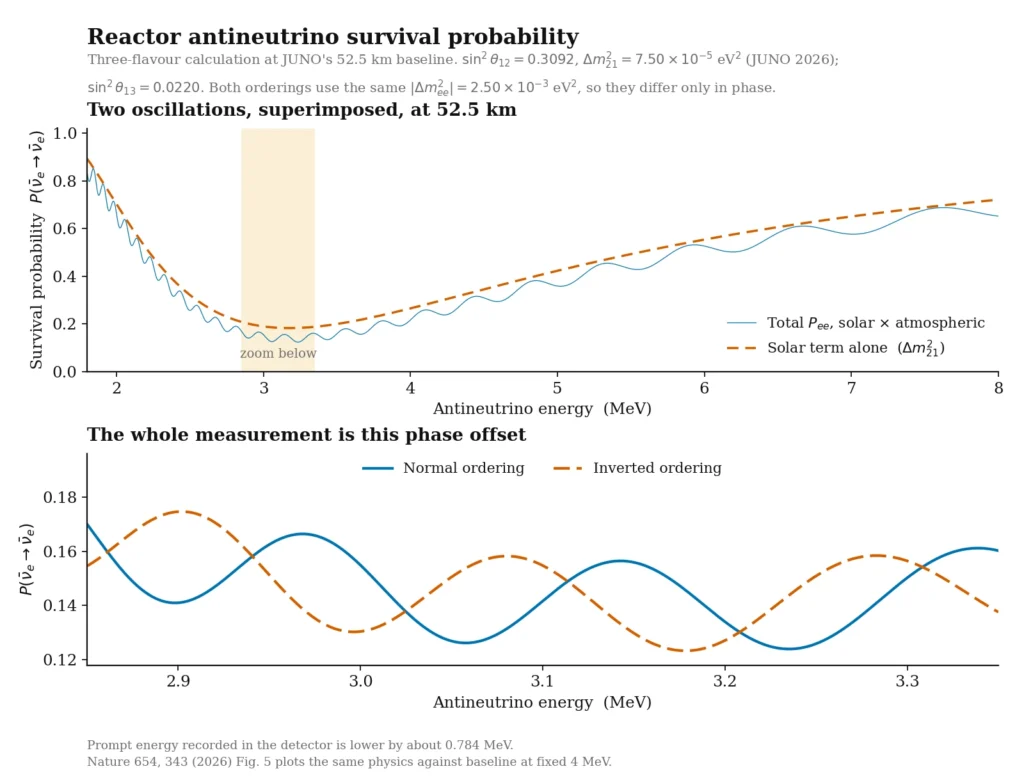
JUNO watches electron antineutrinos from eight reactor cores. Six sit at Yangjiang at 2.9 GW thermal each, two at Taishan at 4.6 GW each. That is 26.6 GW thermal at an average baseline of 52.5 km.1 It sees them through inverse beta decay, in which an antineutrino strikes a proton and produces a positron and a neutron whose delayed capture provides the coincidence tag. The baseline is not an accident of geography. It sits at the first maximum of the slow “solar” oscillation, the one driven by the mass-squared difference Δm²₂₁.4
The mass ordering hides in the fine structure riding on top of that slow oscillation. Fast wiggles driven by the much larger atmospheric splitting, Δm²₃₁ and Δm²₃₂, modulate the broad solar dip, and the relative phase of those wiggles differs between the normal ordering and the inverted one. Reading the ordering therefore means resolving the shape of the antineutrino energy spectrum finely enough to tell two interference patterns apart. In practice that requires energy resolution of about 3% divided by the square root of the energy in MeV, and an energy scale known to better than 1%.4, 5
What makes the approach distinctive is what it does not need. The oscillation over 52.5 km is dominated by vacuum propagation. So the result does not lean on matter effects in the Earth’s crust. It does not depend on the unknown leptonic CP phase, or on θ₂₃. Spokesperson Wang Yifang has made the point directly in CERN Courier: the determination is largely free of the parameter degeneracies that complicate the accelerator and atmospheric approaches.11 The cost of that independence is paid entirely in detector performance.
What the physics demands
Roughly 50 keV of spectral structure, resolved near 3 MeV, across a target weighing 20,000 tons. Every engineering number below exists to make that one measurement possible.
The machine as built
The central detector is an acrylic sphere 35.4 m in inner diameter. It was assembled by bonding 263 panels 120 mm thick, held by 590 connecting bars inside a stainless steel latticed shell 41.1 m across.1 The sphere is submerged in a cylindrical water pool 43.5 m across and 44.0 m high, which serves both as a Cherenkov muon veto and as radioactivity shielding. A high-purity water buffer at least 1.5 m thick separates the vessel from the photomultipliers. The outer water Cherenkov detector is at least 1.55 m thick, instrumented with 2,752 microchannel-plate tubes and 600 8-inch tubes.2 Almost 1,000 m² of plastic scintillator sits above roughly 60% of the pool as a Top Tracker. It is refurbished from the OPERA experiment and reconstructs muon tracks to 0.20°. The whole assembly sits under 1,800 metres of water equivalent of granite in Kaiping, Jiangmen.1
The as-operated photosensor inventory is 17,596 20-inch photomultipliers on the central detector, split between 4,939 Hamamatsu R12860-50 dynode tubes and 12,657 NNVT GDB6201 microchannel-plate tubes, plus 25,587 3-inch tubes.1 That gives about 75% geometrical coverage from the large tubes and 78% in total.2 The two photosensor systems are not redundancy for its own sake. Large and small tubes saturate differently. Comparing them is how the collaboration controls the energy non-linearity that the mass ordering cannot tolerate. Readers checking against older design documents will find 17,612 and 25,600 quoted. The commissioning paper reports the as-built count, and those are the numbers used here.
The construction timeline is unusually well documented. Civil works began in January 2015. Installation of the steel structure started on 19 December 2021, the first acrylic panel went in on 27 June 2022, and photomultiplier and electronics installation ran from 23 October 2022 to 17 December 2024. Sixty kton of ultrapure water were filled in 45 days, between 18 December 2024 and 2 February 2025. The level difference between sphere and pool was held to a few centimetres. The water-to-scintillator exchange ran from 8 February to 22 August 2025. Physics data-taking began four days later.1
Light: the number everything else rests on
Energy resolution in a scintillator detector is, at bottom, photon counting statistics. Collect more photoelectrons per MeV and the fractional width of an energy peak shrinks. JUNO reports 1785 photoelectrons per MeV at the detector centre, measured on the 2.223 MeV gamma from neutron capture on hydrogen using an americium-carbon calibration source.1 For comparison, KamLAND, the previous largest liquid scintillator detector, was about 20 times smaller and achieved roughly half the resolution.11
Getting that many photons out of a sphere 35 m across requires the scintillator to be almost absurdly transparent. The measured attenuation length is 20.6 m at 430 nm, against a design requirement above 20 m and a simulation that assumed exactly 20.0 m. The surrounding water exceeds 70 m attenuation length at 400 nm, where the simulation assumed 40 m.1 The scintillator itself is linear alkylbenzene with 2.5 g/L of PPO as fluor and about 3 mg/L of bis-MSB as wavelength shifter. It is purified on site in three stages: an alumina column for optical clarity, vacuum distillation to strip uranium, thorium and potassium, then water extraction and nitrogen stripping to remove dissolved radon, krypton and argon.1
The photomultipliers are holding up. Average dark count rates are 20.6 kHz for the Hamamatsu dynode tubes and 22.7 kHz for the NNVT microchannel-plate tubes, and the rates are falling with time rather than rising. Gains sat near 0.65 × 10⁷ and 0.72 × 10⁷ respectively and were stable across the first two months. Of the 20,348 20-inch tubes installed, 22 were dead by November 2025, a failure rate of 0.11%. Between 2% and 3% of tubes flash, and about 70% of those can be run at reduced gain rather than switched off. Waveform timing is aligned to better than 1 ns, the ADC sampling interval. Electronics noise on the small tubes is 0.04 photoelectrons with crosstalk under 0.4%.1
Achieved against design
Light yield 1785 PE/MeV. Scintillator attenuation 20.6 m against a 20 m requirement. Water attenuation above 70 m against 40 m simulated. Dead large photomultipliers, 0.11%. Data acquisition duty cycle above 97.8%. Muon tagging efficiency in the water Cherenkov veto above 99.9%.
Radiopurity, an order of magnitude past requirement
A reactor antineutrino signal at a few MeV competes with natural radioactivity in the target itself. JUNO measures intrinsic uranium-238 at (7.5 ± 0.9) × 10⁻¹⁷ g/g and thorium-232 at (8.2 ± 0.7) × 10⁻¹⁷ g/g. Both are derived from bismuth-polonium coincidences.1 Both sit an order of magnitude below the level the mass ordering measurement requires. Radon-222 in fresh scintillator is below 1 mBq/m³ against a 5 mBq/m³ requirement, which is the level the collaboration treats as the ideal case for the solar neutrino programme. Polonium-210, out of equilibrium and therefore the awkward one, averaged (4.3 ± 0.3) × 10⁴ counts per day per kton over filling. Intrinsic carbon-14 relative to carbon-12 is (3 to 5) × 10⁻¹⁷.1
The water plant removes more than 99.9% of radon, holds radium below 4 μBq/m³ and resistivity above 18 MΩ·cm.1 Radiopurity during filling was monitored by OSIRIS, a 20-ton pre-detector built for exactly that job. Worth noting what the paper does not report: there is no measured concentration for potassium-40, bismuth-214 or krypton-85. Potassium-40 appears only as a 1.460 MeV calibration line, bismuth-214 is used to derive the uranium chain rather than quoted on its own, and krypton is mentioned only as something the stripping removes.
Energy resolution, stated carefully
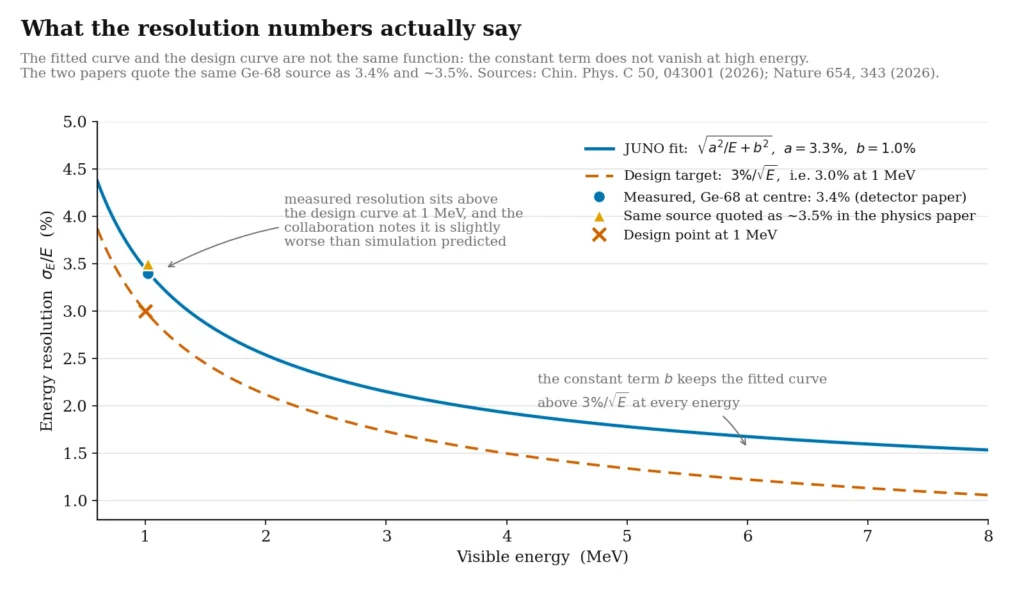
This is the number the whole experiment turns on. It is also the one that most needs care in how it is reported. The design target is 3% at 1 MeV.16 The commissioning paper quotes 3.4% reconstructed energy resolution for the 1.022 MeV pair of gammas from a germanium-68 source at the detector centre. It quotes 2.9% for the quenched 0.93 MeV alpha from polonium-214 in the natural radioactivity. Fitting the standard form, the square root of a²/E plus b², gives a stochastic term near 3.3% and a constant term near 1%.1
The supporting numbers are tight. Energy non-linearity for positrons is known to 1%. The overall energy-scale uncertainty is 0.5%. Residual non-uniformity inside the fiducial volume is within 0.4%, and drift over the run was 0.2%.2
That calibration rests on a multi-part system. An on-axis automatic unit, a cable loop for the vertical plane, a guide tube for the boundary, and a remotely operated vehicle for full-volume coverage. Between them they deploy neutron, gamma and pulsed-laser sources.8
Measured, and asserted
Neither paper publishes an extrapolated resolution at 1 MeV. The measured points do not sit on the design curve. The physics paper is explicit: resolution for the germanium-68 source is approximately 3.5%, and performance for gammas at the centre is slightly worse than simulation predicted.2 The commissioning paper quotes 3.4% for the same source.1 Against a target of 3% at 1 MeV, that is a shortfall on this benchmark. The collaboration reports it openly rather than smoothing it over.
Two caveats cut the other way. Compton scattering degrades gamma resolution relative to positrons. And positron resolution, not gamma resolution, is what the mass ordering needs. Two smaller notes: the polonium-214 figure appears as 2.9% in the abstract and 2.8% in the body, and the line that JUNO has met its specification traces to press communications.13, 14
The calibration behind those numbers is extensive. Five gamma sources, an americium-carbon neutron source and a UV laser were deployed on axis and at two off-centre positions, placed to better than 1 cm. A further 39 off-axis points were reached by cable loop at about 3 cm precision.2, 8 The non-linearity model was constrained by eight gamma lines from 0.511 to 6.13 MeV plus continuous cosmogenic boron-12 and carbon-11 spectra. Position reconstruction, handled by three independent algorithms, shows vertex bias within 10 cm across nearly the whole volume. Resolution is presented as curves rather than a single headline value, which is the honest choice for a quantity that varies strongly with radius.1
Fifty-nine days
Between 26 August and 2 November 2025, JUNO accumulated 59.1 days of live time across 69 calendar days. The entire result rests on 2,379 antineutrino candidates. Total selection efficiency was 69.9%, with a fiducial cut at 16.5 m radius accepting 80.6% of the volume.2 After correction the signal rate is 47.9 ± 2.6 events per day, against a non-oscillated expectation of 150.9 ± 2.7. The dominant background, cosmogenic lithium-9 and helium-8, fits to 3.9 events per day.
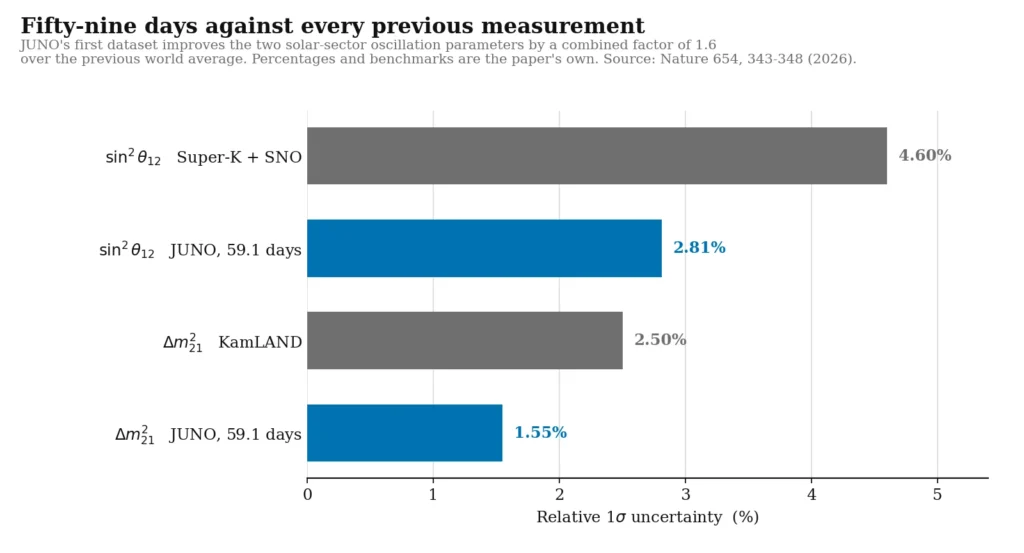
From that exposure came sin²θ₁₂ = 0.3092 ± 0.0087 and Δm²₂₁ = (7.50 ± 0.12) × 10⁻⁵ eV², for normal ordering. The inverted-ordering fit is fully compatible.2 In relative terms those are 2.81% and 1.55%. The previous best on Δm²₂₁ was KamLAND at roughly 2.5%. On sin²θ₁₂ it was the Super-Kamiokande and SNO solar combination at roughly 4.6%. Together, JUNO improved on the entire prior world combination by a factor of 1.6.2
Two features of the analysis are worth noting for anyone weighing how much to trust a two-month result. The oscillation parameters were blinded throughout, with reactor power and fission fractions unblinded only after the analysis framework was frozen, and three independent analysis chains with different treatments of the covariance matrix returned mutually consistent answers.2 The measured antineutrino rate also tracks reactor operations week by week, including the power reduction at Yangjiang when Super Typhoon Ragasa hit on 24 September.2
The effect on the field was immediate. Global oscillation fits published within weeks of the preprint report that the combined determination of the solar parameters is now dominated by JUNO alone.10 The paper ran as the cover article in Nature on 10 June 2026.2 The commissioning paper, meanwhile, was an Editors’ Suggestion and cover story in Chinese Physics C, and had accumulated on the order of 39 citations by mid-2026, which is fast for a detector performance paper.12
What is not in hand yet
Δm²₃₁, the parameter that carries the fast wiggles, remains statistics-limited at this exposure.2 That is the expected ordering of events. The slow solar oscillation is a large-amplitude feature that a short run can pin down. The ordering lives in a small phase difference, and that needs both far more events and a precisely known input spectrum.
Supplying that input spectrum is the job of TAO, the Taishan Antineutrino Observatory. It is a roughly 2.8-ton gadolinium-doped scintillator detector, sited about 30 to 44 m from a Taishan core. It reads out through some 10 m² of silicon photomultipliers cooled to −50 °C to suppress dark noise. It collects around 4,500 photoelectrons per MeV and achieves better than 2% energy resolution at 1 MeV, which lets it measure the reactor spectrum shape model-independently and remove that uncertainty from JUNO’s fit.7
Projection, not measurement
The collaboration’s 2022 projection put a 3σ determination of the ordering at roughly six years of running, and joint JUNO plus TAO studies land near 6.5 years.5, 6 An independent 2021 reassessment was more cautious, estimating only a 31% probability that JUNO alone reaches 3σ by 2030, with the answer highly sensitive to the true value of Δm²₂₁.9 These are sensitivity estimates conditioned on reactor duty cycle and on parameters that were, until this year, poorly known. JUNO’s own improved Δm²₂₁ feeds directly back into its own forecast, which is one reason the 59-day result matters beyond the headline precision.
Where it sits in the field
JUNO’s independence from matter effects is exactly what makes it complementary rather than redundant. DUNE will read the ordering from matter effects over a 1,300 km accelerator baseline. Hyper-Kamiokande is optimised for CP violation. KM3NeT/ORCA and the IceCube Upgrade look for matter effects in atmospheric neutrinos between 2 and 12 GeV. Because JUNO’s determination is vacuum-dominated and free of the usual degeneracies, agreement between it and the others is a test of the three-flavour framework itself, and disagreement would be a constraint on non-unitarity or non-standard interactions.3, 4
The lineage is direct. Daya Bay supplied the θ₁₃ measurement, the scintillator optimisation and much of the calibration heritage. KamLAND was the previous largest liquid scintillator detector and the previous holder of the Δm²₂₁ record. Borexino developed the radiopurity techniques that make a 20 kton target thinkable.11 The same detector has other jobs. It is a solar neutrino instrument targeting beryllium-7, boron-8, pep and CNO fluxes, and eventually the MSW transition region. It is a geoneutrino detector,15 an atmospheric neutrino detector with an independent handle on the ordering, a supernova burst monitor, and a proton decay search sensitive to the kaon channel that water Cherenkov detectors struggle with.4
The honest summary
Everything that can be verified about JUNO after one year is verified and good. The light yield, the transparency, the radiopurity, the veto efficiency and the duty cycle all meet or beat their design values, and the first physics result is genuinely world-leading. What has not been demonstrated is the thing the detector was built for. The mass ordering requires the fast wiggles to emerge from statistics that do not yet exist, with a reference spectrum from a satellite detector, on a timeline that remains a projection. The commissioning paper is a strong argument that the projection is credible. It is not the measurement.
References
- JUNO Collaboration (A. Abusleme et al.), Initial performance results of the JUNO detector, Chin. Phys. C 50, 043001 (2026). DOI 10.1088/1674-1137/ae3dc1. Preprint arXiv:2511.14590. Editors’ Suggestion and issue cover story.
- JUNO Collaboration, Measurement of reactor neutrino oscillation with the first JUNO data, Nature 654, 343–348 (2026). DOI 10.1038/s41586-026-10538-z. Published 10 June 2026. Preprint issued as First measurement of reactor neutrino oscillations at JUNO, arXiv:2511.14593.
- News and Views, JUNO experiment ushers in next generation of neutrino experiments, Nature (2026). d41586-026-01585-7.
- JUNO Collaboration, JUNO physics and detector (2022). arXiv:2104.02565.
- JUNO Collaboration, Sub-percent precision measurement of neutrino oscillation parameters with JUNO, Chin. Phys. C 46, 123001 (2022). arXiv:2204.13249.
- JUNO Collaboration, Potential to identify neutrino mass ordering with reactor antineutrinos at JUNO, Chin. Phys. C 49, 033104 (2025). arXiv:2405.18008.
- JUNO Collaboration, TAO Conceptual Design Report (2020). arXiv:2005.08745.
- JUNO Collaboration, Calibration strategy of the JUNO experiment, JHEP 03, 004 (2021).
- Independent reassessment of JUNO mass-ordering sensitivity, Phys. Rev. D 104, 113004 (2021).
- F. Capozzi et al., global three-flavour oscillation fit including the first JUNO data (2025). arXiv:2511.21650.
- JUNO takes aim at the neutrino mass hierarchy, CERN Courier, including comments from spokesperson Wang Yifang.
- Institute of High Energy Physics / Chinese Physics C, cover story announcement, Issue 4 (2026).
- GSI Helmholtzzentrum für Schwerionenforschung, press release on JUNO trial operation, 29 August 2025.
- Joint Institute for Nuclear Research (JINR), press summary of JUNO commissioning performance (2025).
- JUNO Collaboration, geoneutrino measurement prospects (2025). arXiv:2511.07227.
- JUNO Collaboration, Prediction of energy resolution in the JUNO experiment, Chin. Phys. C 49, 013003 (2025). Source of the 3% at 1 MeV design target.
- A. Gando et al. (KamLAND), Reactor on-off antineutrino measurement with KamLAND, Phys. Rev. D 88, 033001 (2013); K. Abe et al., Solar neutrino measurements using the full data period of Super-Kamiokande-IV, Phys. Rev. D 109, 092001 (2024). The two benchmarks JUNO improves on.
- F. P. An et al. (Daya Bay), Phys. Rev. Lett. 130, 161802 (2023), the external constraint on sin²θ₁₃ and Δm²₃₁ used in the JUNO fit; M. Abreu et al. (SNO+), Phys. Rev. Lett. 135, 121801 (2025).
Note on sourcing
All detector performance figures trace to the peer-reviewed commissioning paper in Chinese Physics C, and all oscillation parameters to the peer-reviewed Nature paper. Where the two papers disagree, both values are given: the germanium-68 resolution is 3.4% in the commissioning paper and approximately 3.5% in the physics paper. The claim that JUNO has met its resolution specification is a press-release framing rather than a published 1 MeV measurement, and is identified as such above. Mass-ordering timelines are sensitivity projections conditioned on reactor duty cycle and on parameter values, not measurements. Photomultiplier counts follow the as-built numbers in the commissioning paper rather than the design documents. The paper’s byline lists roughly 1,140 authors; the collaboration is officially more than 700 researchers across 74 institutions in 17 countries and regions.
Keep reading
One issue a week. No hype, no collapse jokes.
New writing on quantum science and the engineering it is becoming, sent once a week.
Subscribe freeContinue reading
More from the archive
Universal Quantum Gates from Anyons: How S3 Topological Computing Works
A 54-qubit trapped-ion experiment demonstrates universal quantum gates using the braiding and fusion of non-Abelian anyons in an S3 quantum double, without relying on…
The fourth neutrino was excluded at 99.99%. The anomalies are still there.
A fourth neutrino that feels no weak force explained thirty years of anomalies. MicroBooNE excluded it at 95% confidence and KATRIN found no kink…
Six antineutrinos a day, measured from a reactor that had been switched off for weeks
A pressurised water reactor that has been offline for three weeks still sends about six antineutrino events a day into a detector 400 metres…